Chances are you got a mail from your designer and you have been googling down a few words that had you scratching your head.
You could have replied saying, “I didn’t understand your previous mail. I have no idea what crop marks and bleed marks mean. Can you use simple words? I don’t speak design.”
But you don’t like to say that. After all, you have google by your side, and this article to help you understand the few important words that designers tend to throw at you.
Some Words To Help You Understand and Speak Design:
Oxford describes the term design as “a plan or drawing produced to show the look and function or workings” of a product before it’s made.
Here are some words you should know if you are working with a designer.
1. Wireframe

Wireframe, to put it simply, is the blueprint. You visualize the end product and make a simple sketch in grayscale, i.e. without any colors. You plan and decide which objects go where i.e. where you would place the images and text.
In other words, designers make wireframes to express the overall layout of the design, including the arrangement of the graphics and text. A wireframe lets the client know what the end product would look like.
Extra: After the wireframe is finalized, the designer would then create a “mockup”, which serves as the experimental model for the end product. Unlike a wireframe, a mockup has colors and graphics.
2. Bleeds and Crop Marks

You know that printers don’t print all the way to the very edge of the paper. But when you want the graphic layout to get printed right to the very edge of that paper, that’s when you use bleed and crop marks.
Simply put, crop marks sets the trim lines at the corners of the page or image where it is to be trimmed down from after printing. Whereas, bleed is actually the area (usually of 3mm to 5mm in length) that will be cropped.
3. Raster images and vector images
All images are made of tiny squares called pixels or dots (just like matter is made of molecules). Pixels, short for picture element, represent the color information and define the shape of the graphic.
Raster Image:
You are certainly familiar with images of the jpg file format. Like this one.

Well, the designers call them raster images, and such images are made of a finite number of pixel. So, if you would enlarge a raster image, you would notice that they lose their quality and reveal square like cells.
Just open any jpg image on your Windows Photo Viewer, and zoom on o the highest level until you see the tiny square pixels. That is why they are also called bitmap images.
![]()
Common Raster File Formats: Jpg, png, gif, psd, tiff, and bmp
Designer’s Preferred Program: Adobe Photoshop (.psd file format)
Note: On web, we generally use jpg images.
Vector Images:
To ensure that pictures do not lose their quality or get blurred when enlarged, designers began using vector images.
Vector-based graphics use math to remember and retain data. Rather than deciding on the amount of pixels, vector images have points, each with X and Y co-ordinates, which join together to form shapes. So, when resized to a larger size, the computer will join the dots and fill the color element (although the color details would not be as rich as that of raster images).
Owing to this “unblurrable” property, vector graphics are used for company logo as well for the font.
Common Vector File Formats: ai, pdf
Designer’s Preferred Program: Adobe Illustrator (.ai file format)
4. Moodboard
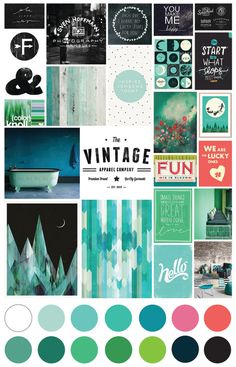
Moodboard is a collage of images and other assets put together by the creative team in regards to a design project. Through a moodboard, the designer would be establishing the tone of the graphic, image treatments, typography style and color palette that they would be using in the design project.
They send out the moodboard to the client for approval before beginning the process.
For clients, the moodboard serves as a window inside the designer’s mind as to how they would build the client’s website or explainer video or other such design projects.
In short, the moodboard serves as the proposed style guide for a design project, helping the client to get the overall feel of the design concept and give feedback at an early stage.
5. Animatic
An animatic is a short animated video. Here at Crackitt, we call them explainer videos. You may also have heard of video overview and demo video. They all mean the same thing. To put it simply, an animatic or an explainer video is a short 1-2 minute video which explains a business or product using graphics and 2D/3D animation technology:
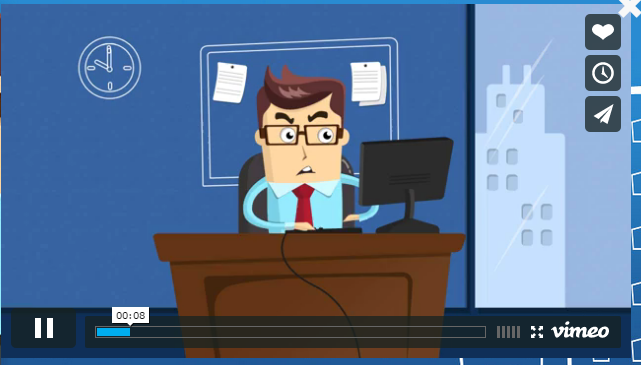
2D Animation: Here, characters and scenes are created in the 2 dimensional space. It uses flat background and the depth of the object is shown by the use of shadows, mass, and their relative position to each other.
3D Animation: Characters and scenes are created in the 3 dimensional space, and movement is possible on all three axes such that it projects life-like motion effects.
2.5D Animation: A 2.5D animation is basically a clever use of 2D animation in 3D space.
6. Storyboard

Much like comics, a storyboard is a series of important scenes and actions that will be played out in the video. It gives a sense of how the video will come out.
The concept of storyboard was first developed and practiced by Walt Disney Studio in the 1930s as a tool for planning engaging story plots before starting the production process. With this approach, they ensure that they don’t waste time, money and effort on producing a not-so-good video.
The storyboarding idea has been taken by video production companies at large, including us at Crackitt. Prior to creating an explainer video or a demo video, the designers would first develop a storyboard to check the flow of the video, the strength of the script and the overall concept. This storyboard is then sent out to the client for approval, and once the good-to-go signal is received the designers dig into the animation process.
7. CMYK, HEX and RGB Color Models

CMYK is a subtractive color model, consisting of four main inks (Cyan, Magenta, Yellow and Key i.e. black) and is used primarily in color printing.
RGB on the other hand is a color model that uses three primary colors- Red, Green and Blue. Combining these three colors, one can get 256 different colors, including black and white.
Likewise, there’s the HEX color model too, which offers approximately 16,777,216 color shades. Each color value starts with the hash symbol #, followed by six digits (a combination of letters and numbers).
8. Responsive Design
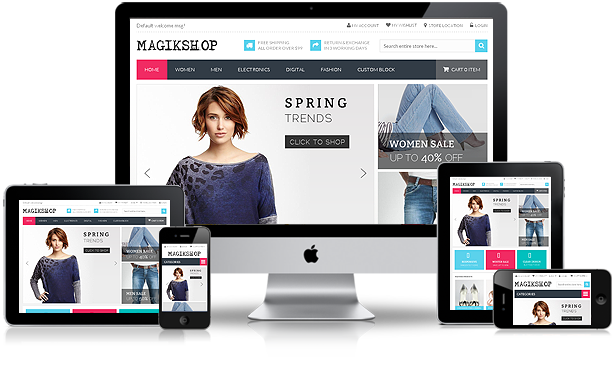
Previously all design works were made for the desktop screen. Now, there are mobiles and tablets and other such devices with different screen sizes. So, if you had designed a website for desktop, then it cannot load properly on the small screen of a mobile user.
This gave rise to the responsive design by which the elements of the website were based on percentage and it could adapt its layout to any display size, rearranging objects to yield a better user experience.
9. Watermark
Do you recall seeing faint words or logo over certain images you stumbled during Google’s image search results?
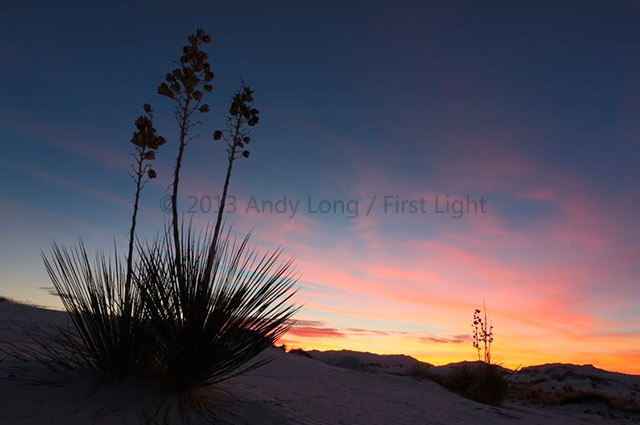
Well, those are called “watermarks”, and they are intended as copyright detail, telling you who owns that picture and warns you not to edit/use such copyrighted images without the permission from the owner.
10. Typography
Typography deals with font design. Designers have to decide which font type, style and size suits the client’s brand the most.
And, while we are talking about typography, I might as well mention the terms ‘leading’ and ‘kerning’. Leading is the designer’s word for that gap between the text lines (you may call it line spacing too) whereas kerning refers to the gap between individual letters in a word. You may consider these small details but when it comes to creating a great design, every little detail matters.
Get exclusive visual marketing lessons and business growth hacks right inside your inbox.
Crackitt is a Conversion-focused Design Agency that specializes in the production of Explainer Videos, Infographics & GIFs. We spend time understanding your core business offering. This knowledge is collected through a thorough analysis of your users which we then use to create stunning visuals (videos or graphics).
5 Jacobs Close,
Epping NSW 2121
174, Udyog Vihar Phase 1,
Gurgaon 122016,
124 Symonds Street Eden Terrace,
Auckland 1010
2035 Sunset Lake Road, Suite B-2,
Newark, Delaware, 19702


